Charts for Qt 4
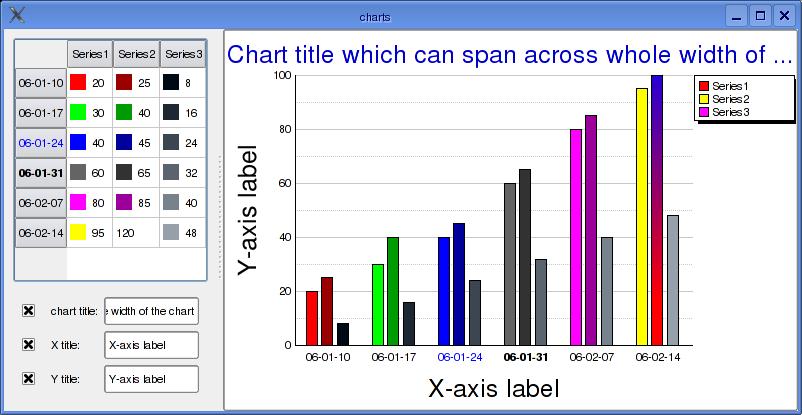
I have started developing widgets for Qt4, which are able to display charts. What’s so special about them? That they use the model-view (MVC) approach, so they integrate well with other Qt4 components.
This is a second preliminary (beta?) release. There are still bugs and unfinished features there and probably some things are not implemented the way they should, so bear with me. The widget was developed using Qt 4.1, but should also work with 4.0 and 4.2.
If you have any comments about my work, ideas, suggestions or bug reports – please don’t hesitate to contact me.
- Features:
- bar (column) chart delegate
- items selectable
- multiple series for every section of the chart
- each item configurable through roles:
- value (Qt::DisplayRole)
- colour (Qt::DecorationRole)
- linear gradient (Qt::DecorationRole)
- tooltip (Qt::ToolTipRole)
- section labels (rows), confgurable:
- name (Qt::DisplayRole)
- colour (Qt::TextColorRole)
- font (Qt::FontRole)
- simple legend with configurable series (columns):
- name (Qt::DisplayRole)
- decoration colour (Qt::DecorationRole)
- legend shadow on/off
- configurable number of vertical grid lines
- configurable range (minimum-maximum) to display
- configurable margins
- scrollable
- scalable
- respects style and palette settings
- chart title
- axis titles
- roles for chart title
- better legend
- Qt::WhatsThisRole for items
- Bugs and limitations:
- only non-negative values allowed
- selection works incorrectly
- not possible to enter what’s this mode
- very high cpu usage
- Features planned for the nearest future:
- point chart delegate
- line chart delegate
- more roles and “subroles” for section and series labels
- horizontal orientation
- helper methods/settings for lazy users
- units (%, km, etc.) for Y-axis labels
- rotated labels so that they have better chance to fit on the chart
- logarithmic scale
- Designer plugin
- Notes on using the chart:
- rows represent sections
- columns represent series
- header data represents labels of sections and series
- a proxy model may be used to adjust the chart to your needs
- Download:
- current version (a simple example of use included)
- previous version